Market Movers
Scan for the most active, top gaining, and top losing securities.
MOST lets you scan the market for the most active securities, top gainers, and top losers, with filtering by category and sector, and both table and pie-chart views.
How to use MOST
Command: MOST
Type MOST in the terminal to open the market movers scanner.
Scan type
Use the Scan dropdown to choose what you're viewing:
- Most Active
- Top Gainers
- Top Losers
Filters
Narrow results down using:
- Category — All, Stocks, Indices / ETFs, Commodities, Majors, Crypto, IPOPs
- Sector — All, Technology, Financials, Communication Services, Consumer Discretionary, Energy, Materials, Healthcare, Industrials, Consumer Staples, Utilities, Real Estate
Table View
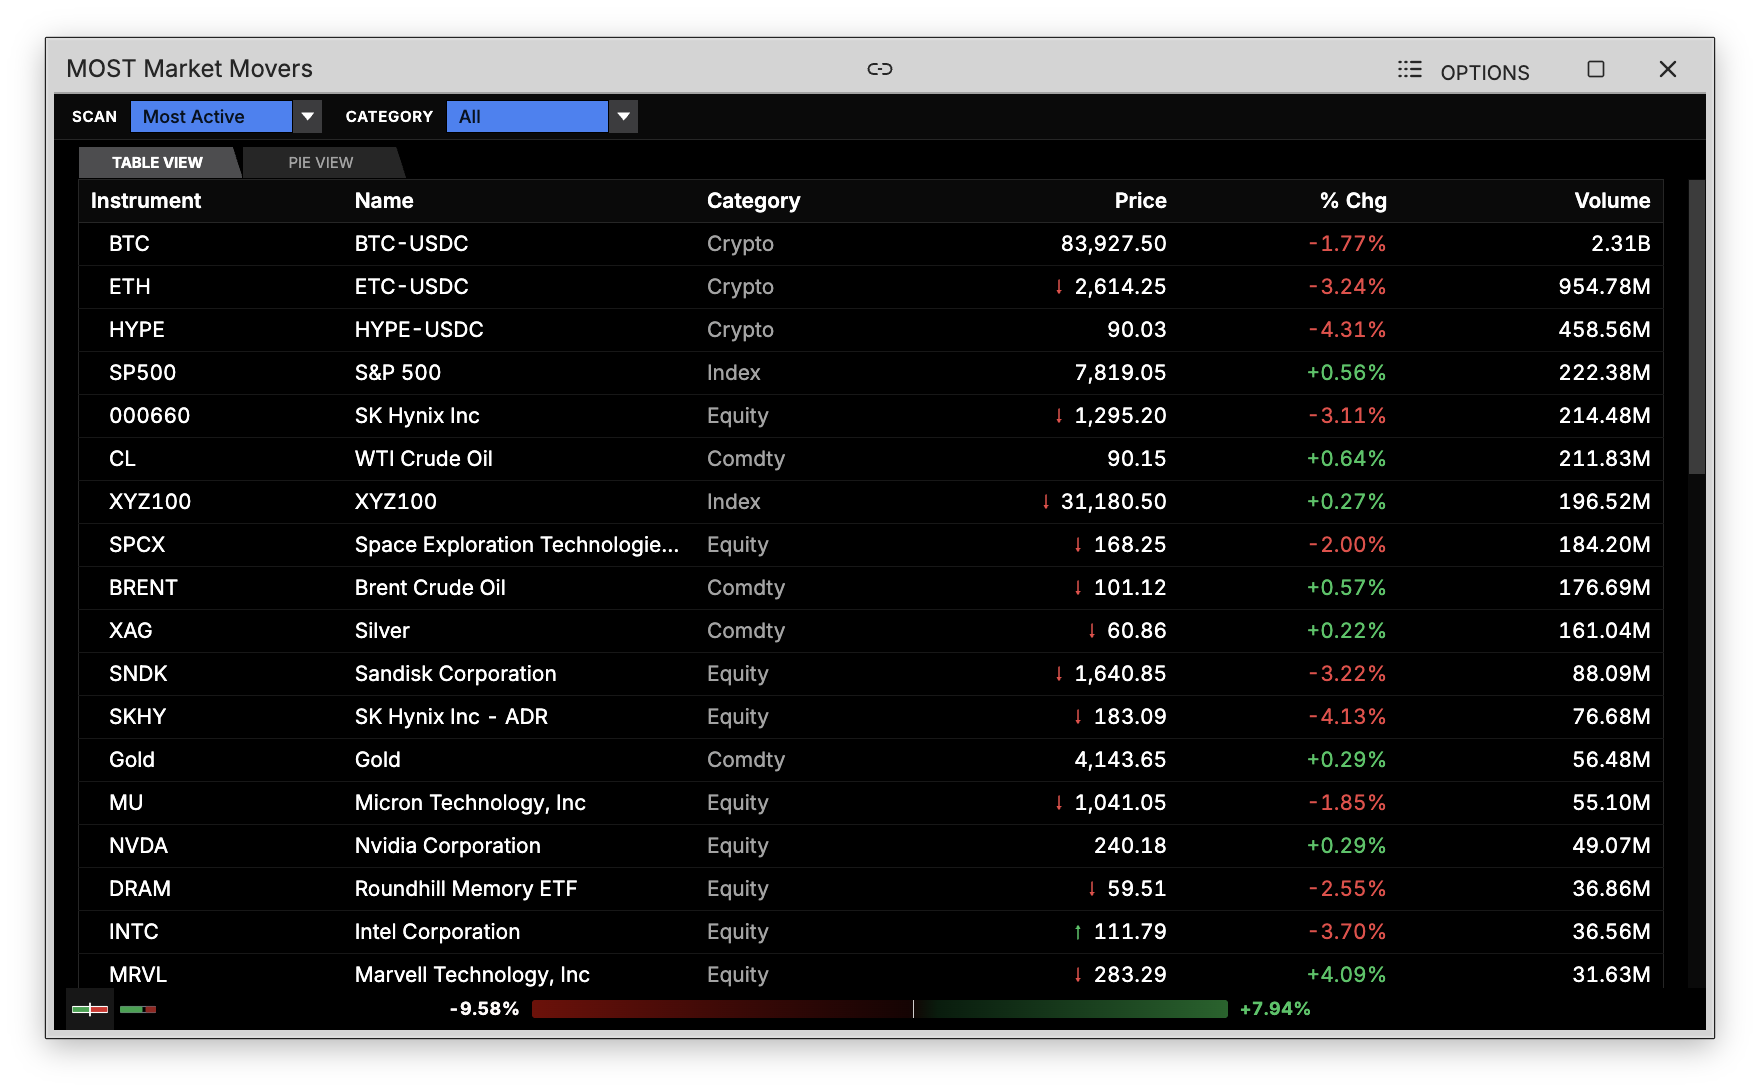
The default view — a sortable table showing Instrument, Name, Category, Price, % Change, and Volume for every result. Click any column header (Price, % Chg, Volume) to sort by that column; click again to reverse the sort direction.
Pie View
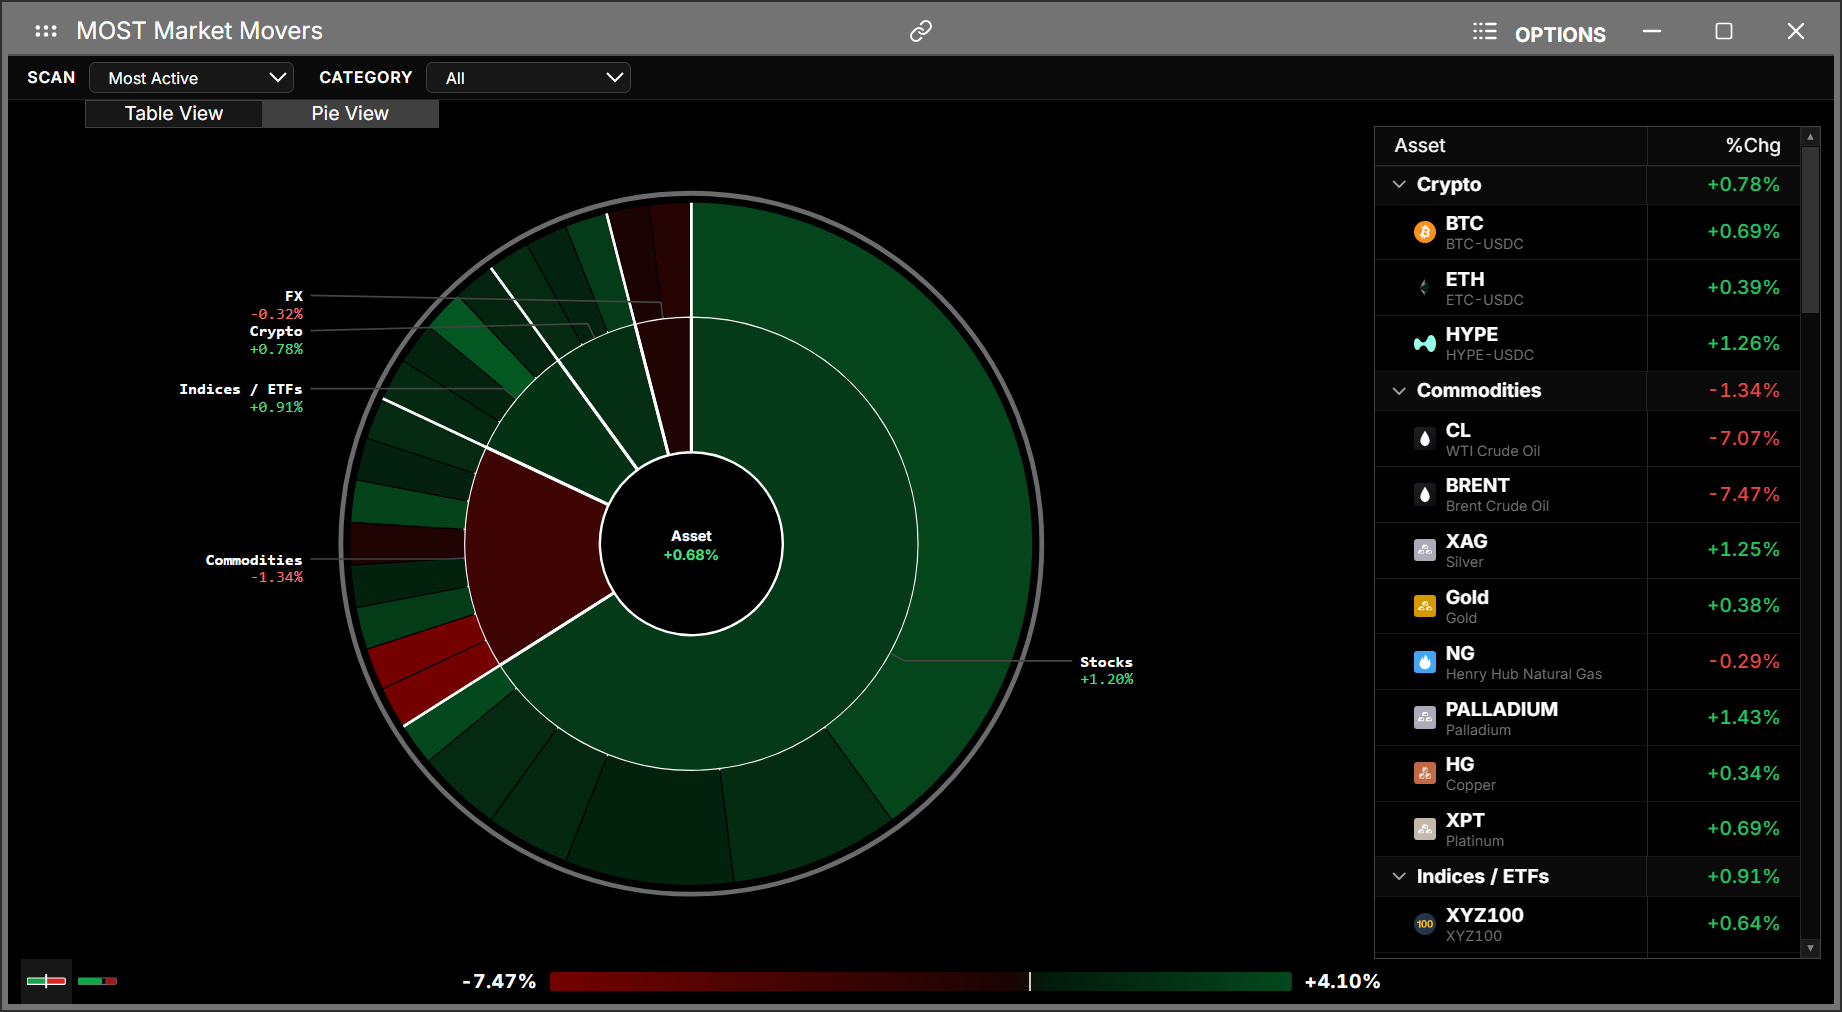
Switch to Pie View to see results as a hierarchical breakdown — by category, then sector, then industry for stocks — with a side table you can expand and collapse at each level. Click any row to expand/collapse that group, or click a leaf-level asset to open it.
Heat bar
Along the bottom, a heat bar shows the overall spread of % change across your current results. Toggle between:
- Range — a gradient bar from the most negative to most positive % change in the current results
- Breadth — a split bar showing the proportion of gainers vs. losers vs. unchanged