GIP
Intraday Graph
Price charting for shorter, intraday timeframes.
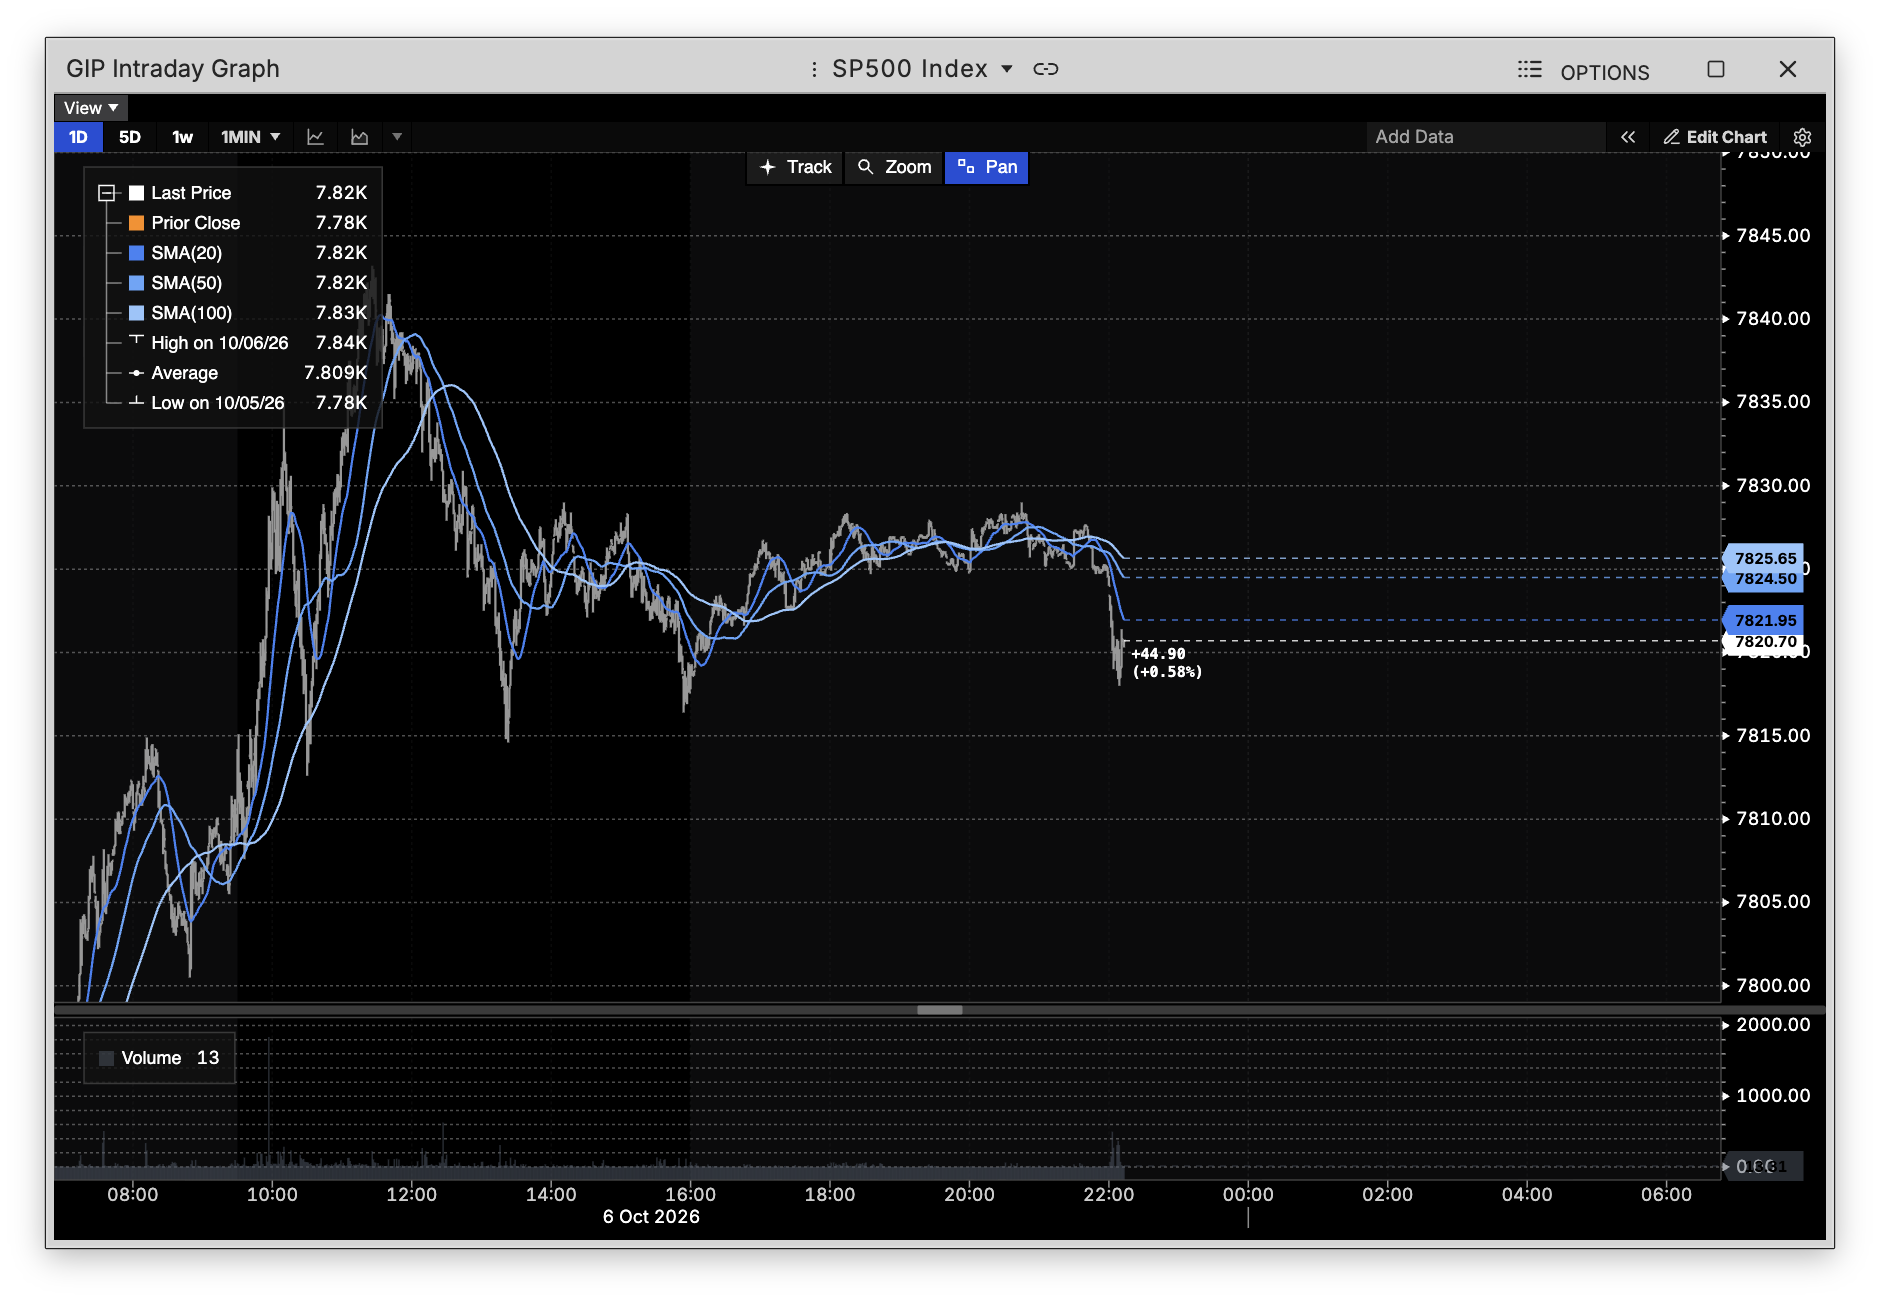
GIP shows price action on shorter, intraday timeframes, giving you a closer look at how a security is trading throughout the day.
How to use GIP
Command: GIP
Type GIP followed by a symbol to open its intraday graph.
Technical indicators
GIP currently supports plotting SMA (Simple Moving Average). More indicators are planned for the future.
Plotting multiple securities
Use the search bar at the top of the graph to add additional securities to the same chart, letting you compare intraday price action across multiple symbols at once.
When to use GIP vs G
Use GIP for shorter, intraday analysis. For longer-timeframe analysis (daily bars and up), use G instead.