G
Graph
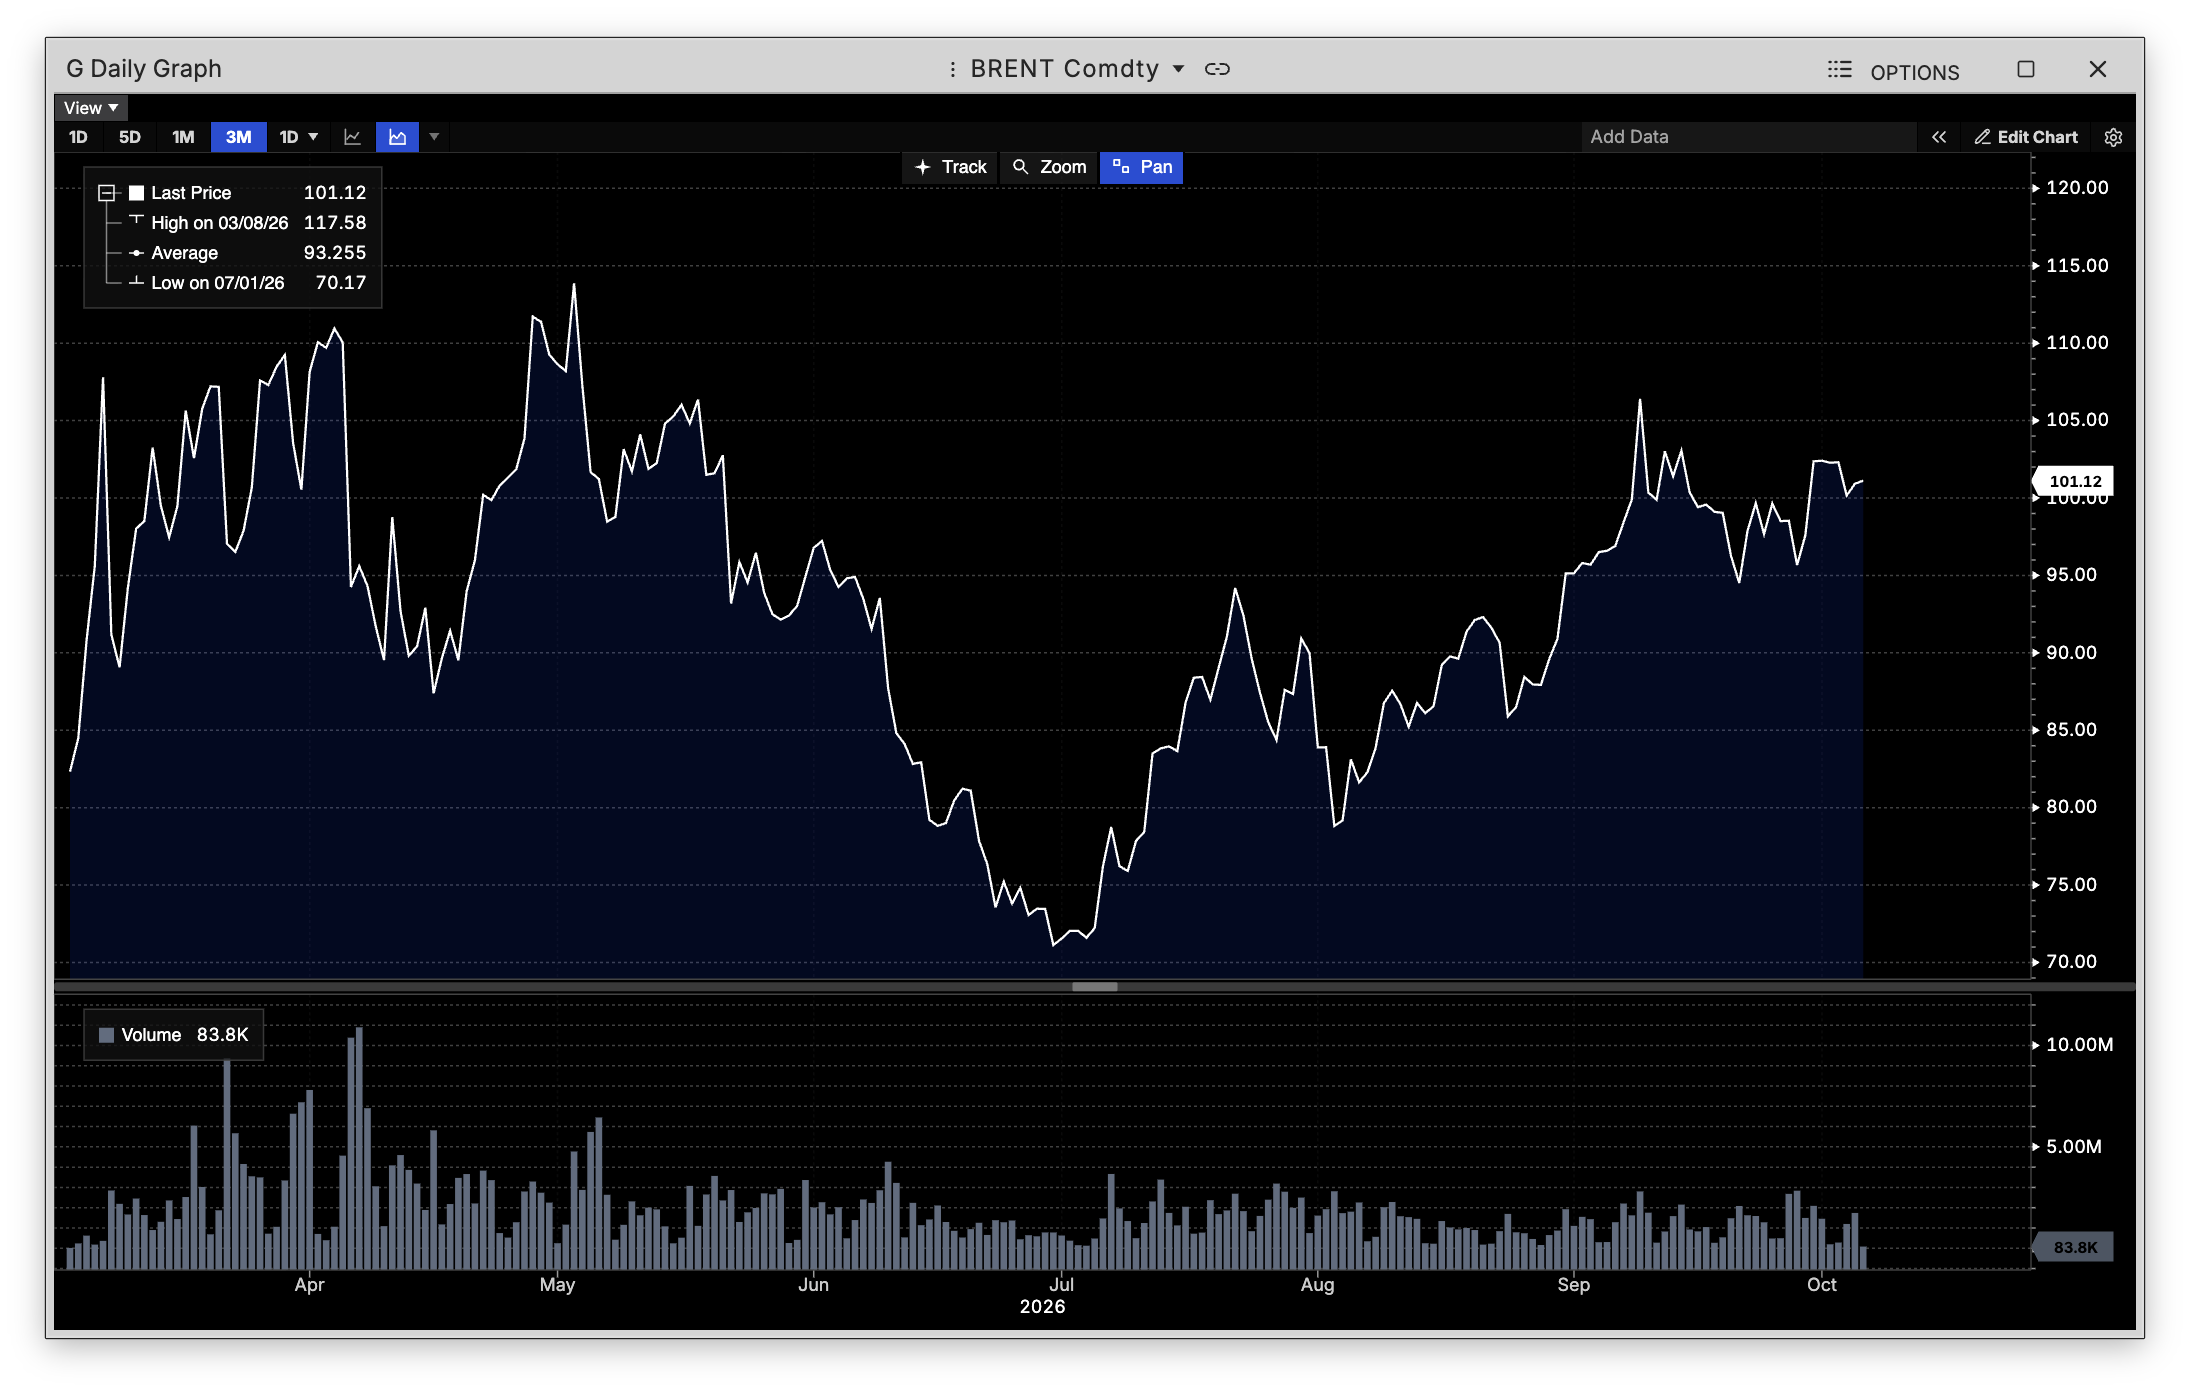
Highly customizable price charting for longer timeframes.
G is a highly customizable graph for viewing price action over longer timeframes — daily bars and beyond — giving you the tools to analyze a security's price history in depth.
How to use G
Command: G
Type G followed by a symbol to open its graph.
Technical indicators
G currently supports plotting SMA (Simple Moving Average). More indicators are planned for the future.
Plotting multiple securities
Use the search bar at the top right of the graph to add additional securities to the same chart, letting you compare price action across multiple symbols at once.
When to use G vs GIP
Use G for longer-timeframe analysis (daily bars and up). For shorter, intraday timeframes, use GIP instead.